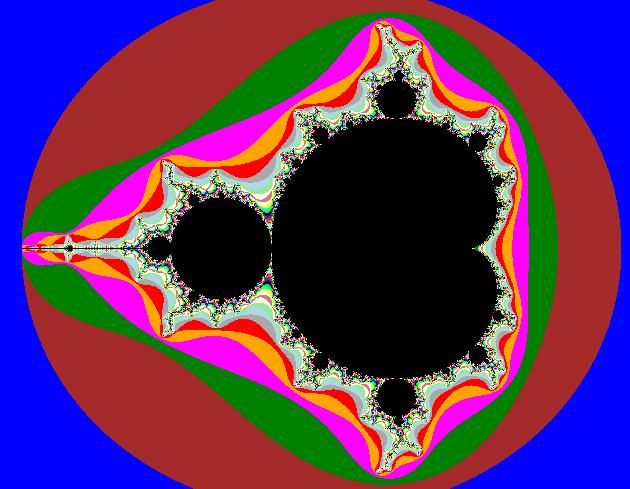
Fractals in C#: Mandelbrot Set
Of all the fractals around, the Mandelbrot set is one of the most famous, largely because it creates quite a complex and beautiful image. In my view anyway.

The actual method of calculating a Mandelbrot is relatively easy to follow. easy, that is, if you know what complex numbers are. A complex number is an imaginary number that is based on the squareroot of -1, which does not exist as a real number, and is usually denoted by i. A complex number is made up of a real part and an imaginary part, in the form Z = x_i_ + y, where x and y are both real numbers, except that x is multiplied by the imaginary i.
Right, so enough maths before I lose you all completely.
So for our function that generates the Mandelbrot, we pass it various parameters which control the scaling, size and offset, which can be used to zoom in on particular areas. This is unimportant in the actual calculation of the fractal, except as modifiers for the calculations so that they calculate the correct area. The important parameters are the iterations, and the powers, as they will directly influence the calculations.
The Complex class which is used in the code to define the complex numbers in a complex number class which I have written, which I wont go into detail here, but is included with the full source code. The workings of the complex number class is covered in a separate post
So, on to how to calculate the Mandelbrot. we first set the two complex numbers, Z and C to the origin (0, 0).
Now we iterate from the top left to bottom right corners of our screen, using the centre of the screen as the coordinates (0,0). When we draw the points physically, we will add the offset to draw on the right location, since (0,0) is the top left corner in most images, but for the calculations , the top left corner will be (-width / 2, -height / 2).
So for each iteration, we adjust the real and imaginary portions of Z using the scaling and offset values, and then set C to Z.
Now, we iterate up to the iteration depth we specified. Each time we iterate, we apply the formula Z = Z^(Power 1) + Z^(Power 2) + C. For a normal Mandelbrot, these values are set to 2 and 0, so for the standard Mandelbrot, this equation becomes Z = Z^2 + C. You are encouraged to experiment with other values to get some really interesting looking images.
If the absolute value of Z is greater than 2, we then stop iterating, and take note of which iteration number we stopped at. This will be used to determine what colour we are going to plot at that point.
So, now we are ready to plot our point, and using the DrawComplexPoint function we plot the point. At this point, we add the offsets needed, as mentioned above, to move our coordinate system to the correct places for our image.
What this function also does is selects the colour to draw. In our code, there are 16 predefined colours in an array, which is selected based on the modulus of the iteration number we found in the previous step.
Color[] oColor = new Color[16];
oColor[0] = Color.Black;
oColor[1] = Color.Blue;
oColor[2] = Color.Brown;
oColor[3] = Color.Green;
oColor[4] = Color.Magenta;
oColor[5] = Color.Orange;
oColor[6] = Color.Red;
oColor[7] = Color.DarkGray;
oColor[8] = Color.LightBlue;
oColor[9] = Color.LightGreen;
oColor[10] = Color.LightYellow;
oColor[11] = Color.PaleVioletRed;
oColor[12] = Color.Ivory;
oColor[13] = Color.Yellow;
oColor[14] = Color.Cyan;
oColor[15] = Color.Lime;

public void Generate(Graphics g, int iIterations, double Scaling, int iInitialSize, double iOffsetRe, double iOffsetIm, int iLeft, int iTop, int iWidth, int iHeight, int iPower, int iPower2)
{
	Complex Z = new Complex( 0.0, -0.0);
	Complex C = new Complex( 0.0, -0.0);
	Complex Offset = new Complex( 0.0, -0.0);

	for (double i = -iWidth/2; i < iWidth/2 ; i++)
	{
		for (double j = -iHeight/2; j < iHeight/2; j++)
		{
			// Normalize Z and adjust for Scaling and Offset

			Z.re = (i/((double)iInitialSize)) * Scaling + (double)iOffsetRe;
			Z.im = (j/((double)iInitialSize)) * Scaling + (double)iOffsetIm;

			// C is the Z(0) of the formula based on the pixel position

			C.re = Z.re;
			C.im = Z.im;

			int iteration = 0;

			// break out if or when |Z| > 2

			for (int k = 1; k < iIterations; k++)
			{
				Z = (Z^iPower) + (Z^iPower2) + C;
				// if modulus of Z > 2, break out of the loop

				// and remember the current iteration to choose the color

				if (Z.Abs() > 2.0)
				{
					iteration = k;
					break;
				}
			}

			// draw the point on the complex plain and choose the color based on the iteration

			// the color is picked by casting the iteration to a KnownColor enumeration

			DrawComplexPoint(g, ((int)i) + (iWidth/2), ((int)j) + (iHeight/2), iteration);
		}
	}
}

private void DrawComplexPoint(Graphics g, int iX, int iY, int iColor)
{
	g.FillRectangle(new SolidBrush(oColor[iColor%16]), iX, iY, 1, 1);
}
The full source code is available at https://github.com/sjmeunier/fractalize.
Originally posted on my old blog, Smoky Cogs, on 30 Sep 2009